GBP/USD Technical Analysis: Pair Approaches Key Support Zone as Market Tests Buyer Strength
GBP/USD is moving closer to an important support area on the daily chart, with price now testing a zone that could decide the next major move. The pair remains under pressure in the short term, but it is also nearing a region where buyers may start to respond.
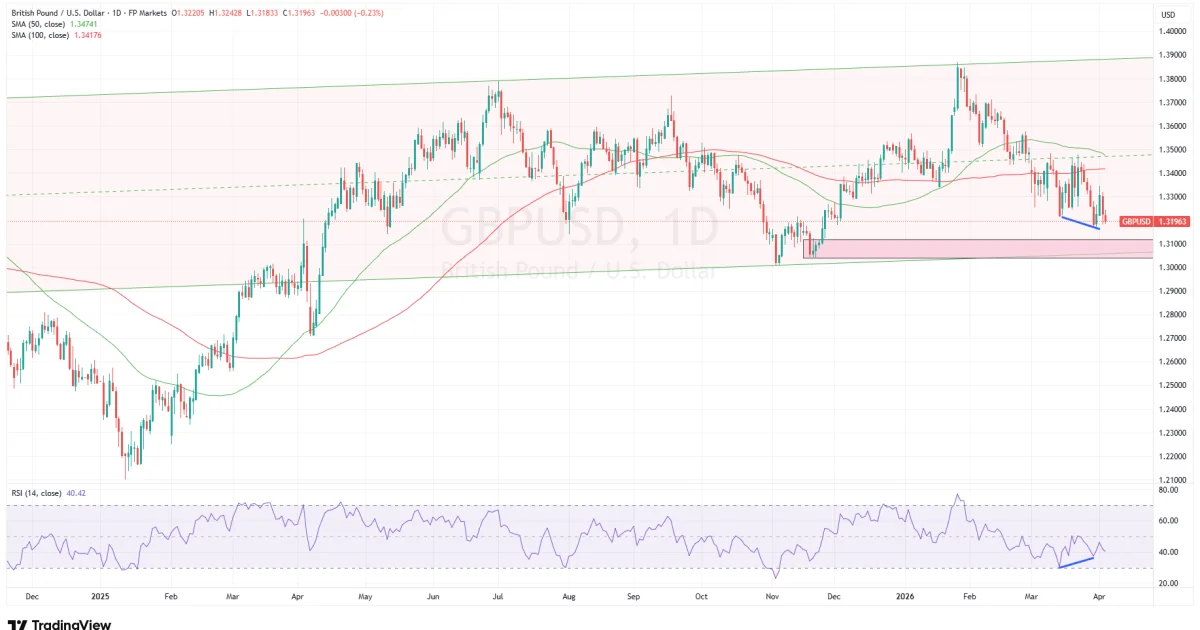
On the daily chart, GBP/USD is trading around 1.3196, after extending its recent decline. Price is now approaching a marked support zone around 1.3110 to 1.3040, which stands out as an important demand area. This region has already shown a positive reaction in the past, so traders will be watching closely to see whether it holds again.
At the moment, the technical structure remains soft because price is trading below both the 50-day SMA near 1.3474 and the 100-day SMA near 1.3418. This shows that the short-term trend is still bearish and that upside recovery attempts remain limited unless the pair can move back above these moving averages.
However, one positive sign is beginning to appear. The chart shows that while price has pushed lower, the RSI is trying to recover from lower levels, which suggests that downside momentum may be slowing. This creates the possibility of a bullish divergence, or at least a loss of selling pressure, as the pair approaches support.
That makes the current area very important. If buyers defend this zone, GBP/USD could try to stabilize and move back higher in a corrective rebound. The first upside levels to watch are around 1.3250, followed by 1.3300. Above that, stronger resistance is seen near 1.3415 to 1.3475, where the moving averages are waiting.
On the downside, the main support remains the 1.3110–1.3040 area. A clean break below this zone would weaken the bullish recovery idea and could open the door for a deeper move toward 1.3000 and possibly lower.
In simple terms, GBP/USD is now sitting near a technically important floor. The broader short-term trend is still weak, but the pair is entering a support region where a reaction is possible. Whether the market bounces or breaks lower will likely depend on how price behaves inside this zone over the next few sessions.
Important levels to watch
Support:
1.3110
1.3040
1.3000
Resistance:
1.3250
1.3300
1.3415
1.3475
GBP/USD is approaching a key support area while trading below its main moving averages, keeping the near-term bias cautious. Still, the RSI is showing early signs of recovery, which means sellers may be losing some strength. As long as the support zone holds, a rebound remains possible. A breakdown below it would shift the focus to further downside.
0 Comments